PAG 31 Conference Preview

The 2024 International Plant & Animal Genome Conference (PAG 31)


For over three decades, the Plant and Animal Genome Conference (PAG) has been a meeting known for fostering collaboration, and showcasing groundbreaking advancements in the fields of plant and animal genomics. Established in 1993, PAG has evolved into a conference that converges experts, emerging talents, and innovators in genomics. This year’s PAG 31 is set to take place from January 12-17, 2024, in San Diego, CA, USA.

This year, the conference will include the following plenary speakers: Appolinaire Djikeng (Centre for Tropical Livestock Genetics and Health), Scott Edwards (Harvard University), Lucy van Dorp (University College of London), Katrien M. Devos (University of Georgia), Amy Marshall-Colón (University of Illinois Urbana-Champaign), Dirk Inzé (VIB-UGent Center for Plant Systems Biology), Virginia Walbot (Stanford University). Notable among them is Scott Edwards from Harvard University, who will lead the Plenary Session on “Comparative Population Pangenomes: A New Frontier for the Evolutionary Analysis of Birds.” Edwards’ expertise in evolutionary biology promises an enlightening exploration into avian genomics, unveiling new frontiers in our understanding of bird populations and their evolution.

The Scientific Programs at PAG 31 present diverse workshops, each dedicated to unraveling distinct facets of genomics. From decoding biodiversity to exploring the intricacies of genome annotation, attendees can expect a comprehensive dive into a wide array of workshops. If you are attending this year’s meeting, here is a list of sessions you might not want to miss.


Day 1, Jan 12, 2024 (Fri)

Vertebrate Genomes Project: Completing Phase 1: Led by Erich Jarvis, this session will give an overview of Phase 1 of the Vertebrate Genomes Project (VGP). The VGP project aims to generate near error-free reference genome assemblies of ~70,000 extant vertebrate species. The goal for phase 1 is to create a chromosome level assembly for 260 vertebrate orders. A talk by Andreas Pfenning from Carnegie Mellon University will highlight the session. His talk will describe how the genomes from the ordinal lineages sequenced in phase 1 are used to detect signatures of genome sequence evolution. Specifically, he will compare coding and noncoding sequences in the genome and how they evolve.

ORG.one Genomes for Conservation of Critically Endangered Species – ORG.one is a pilot-stage initiative sponsored by Oxford Nanopore designed to expedite the sequencing of critically endangered species. Through this project, biologists are able to rapidly sequence species near the individual’s habitat without harming or sacrificing the endangered individual. This workshop will highlight the latest developments in organizational initiatives, sequencing facilities, and the creation of de novo reference genomes. Discussions will delve into recent progress in nanopore sequencing, genome assembly, annotation, and their practical use in conservation genomics. Aziz Ebrahimi of Purdue University will present his research on the white walnut tree. Gabrielle Hartley of the O’Neil lab at the University of Connecticut will be giving a talk on the Eastern Hoolock Gibbon and the rapid karyotype evolution of small apes.

Animal Genomics and Adaptation to Climate Change: This workshop will provide insight on the implications of climate change for animal agriculture, spanning extreme weather, drought, heatwaves, and shifts in pathogen distribution. These elements significantly impact food security and animal farming across both well-equipped and under-resourced global regions. Understanding the genomic and physiological responses of animals facing climate change is pivotal in devising strategies to counter its adverse effects. This enables the use of tactics like breeding climate-resilient animals and adopting innovative management methodologies. One of the talks will be by Jared Decker from the University of Missouri. The title of his talk is “Matching Cattle Genetics to the Environment Using Genomics.” He will discuss genotype-by-environment genome-wide association analyses his lab has run on cattle in his talk.

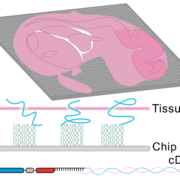
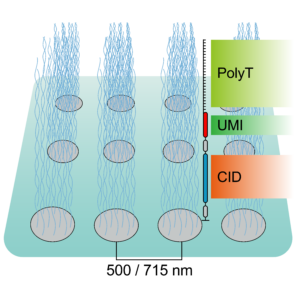
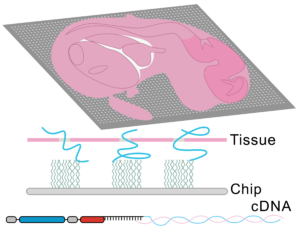
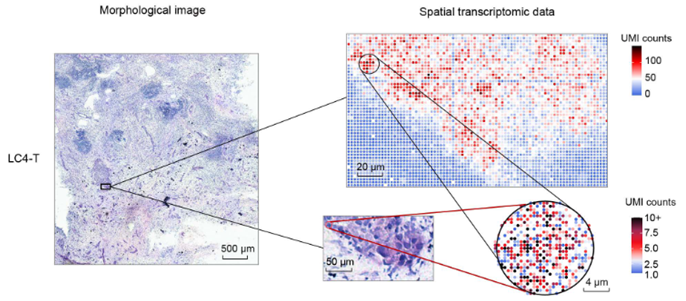
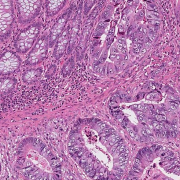
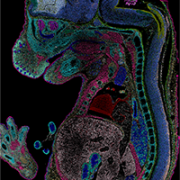
Spatially Resolved Transcriptomics in Plant and Animal Species

New developments in spatial transcriptomics have improved the ability to identify cell types, map cell-fate lineages, and unveil interactions between cells. The ability to characterize gene expression across the entire genome at a subcellular level is crucial for defining single-cell functions and understanding their microenvironments. The strengths and weaknesses of technologies will be discussed. An emphasis on the importance of having complete transcriptome data, as opposed to only having a small panel of genes, will be discussed. The importance of having subcellular resolution will also be addressed. During this session, Mathew Lewsey will give a talk titled “Spatially Resolved Transcriptomic Analysis of the Germinating Barley Grain.” His talk will outline the changes in gene expression during early plant development. This is the phase when the embryo undergoes cellular transitions to become a seedling. Later, during the session, Marc Libault from the University of Missouri will present how his lab uses spatially resolved transcriptomics and metabolomics to understand the cellular complexity in plants.


Day 2, Jan 13, 2024 (Sat)

Single Cell Genomics: This workshop will cover transcriptomics at the cellular level using single-cell analysis techniques. The analysis will be presented using omics approaches and integrating multi-omics data from single cells using novel computational methods. During this session, Gunvant Patil, from Texas Tech University, will present single nucleus RNAseq (snRNAseq) data and gene-editing results to characterize cellular heterogeneity and transcriptional dynamics in soybean leaf. His presentation will focus on the genes and pathways required for the cell-specific accumulation of minerals (ex. Silicon). Also, during this workshop, Maggs X, from Wes Warren’s lab at the University of Missouri, will deliver a talk on a whole brain transcriptome atlas for the blind cavefish (Astyanax mexicanus). Their transcriptome atlas has been supplemented with snRNAseq data from Pachón cave and Rio Choy surface populations. These two populations differ because the Rio Choy population is exposed to sunlight, whereas the Pachón cave population is cave-dwelling and not exposed to sunlight. The single cell data presented will be from over 60,000 cells with 16 broad cell types. Their project aims to shed light on why cave morphs have dysregulated circadian rhythms, reduced aggression, and differences in sensory processing compared to their surface living relatives.

Scott Edwards will give his plenary talk titled “Comparative Population Pangenomes: A New Frontier for the Evolutionary Analysis of Birds.” His lab is investigating how noncoding regions of the genome are driving phenotypic evolution. He will describe how enhancers regulate gene expression to create diverse phenotypes. To accomplish this, his group is developing statistical models that detect evolutionary changes in enhancer sequences that are associated with phenotypic variation within and between species. To validate these statistical models, his lab plans to functionally test how enhancer variations change the development of the forelimb and hindlimbs in birds.


Day 3, Jan 14, 2024 (Sun)

Computational Gene Discovery – This workshop will provide an update on algorithms and software tools (pipelines) for plant and animal genome annotation. Evgenia Kriventseva will discuss the improvements made in ortholog annotation by the new OrthoDB release 11. This latest release provides analysis and annotation for over 100 million genes. Evgenia will also discuss how BUSCO is being used to assess the quality of assembled metagenomes. Also, during this session, Cynthia Webster will introduce EASEL (Efficient, Accurate, Scalable Eukaryotic modeLs). This new genome annotation tool utilizes machine learning, RNA folding, and functional annotations to improve gene prediction accuracy.

Degraded DNA and Paleogenomics – This session will include leading experts in the field of ancient DNA research. In this session, Jonas Oppenheimer will discuss the use of ancient DNA for historical bison populations. Jonas will present evidence from ancient DNA samples to support that bison migrated from Asia across the Bering Land Bridge into the Americas within the past 200,000 years. Once in the Americas, bison separated into two subspecies: wood and plains bison. Later in this session, Beth Shapiro will discuss how genomic data is being used for the hybridization of bison with cattle to create specialized breeds known as cattalo and beefalo. Love Dalen, from Stockholm University, will finish the session with a talk on the biogeography and evolution of North American mammoths. His talk will highlight the gene flow between different mammoth taxa.


Day 4, Jan 15, 2024 (Mon)

Genomics & Biodiversity:

Biodiversity genomics is a rapidly emerging field that captures biological diversity from DNA to ecosystems. Genomics advancements will enhance our understanding of Earth’s biodiversity, promising discoveries vital for present and future societies. This session will discuss how next-generation genomic technologies are being used to describe biological diversity patterns and the mechanisms driving diversification. The topics covered will explore links between genetic variance, biodiversity, and a sustainable world’s health, fostering broader engagement in this exploration.


Day 5, Jan 16, 2024 (Tue)

Functional Annotations of Animal Genomes (FAANG):

The workshop’s primary objectives include:

1) facilitating the sharing of recent FAANG initiatives globally.

2) creating a dynamic platform for the FAANG community to communicate, fostering interactions and collaborations.

During this workshop, Christopher Tuggle, from Iowa State University, will discuss how to assess the success of FAANG and how this can be used for funding the FAANG Farm to Fork agenda. Emily Clark from The Roslin Institute at the University of Edinburgh will provide an update on The H2020 Bovreg Project: An Integrated Functional Annotation of the Bovine Genome. In this talk, she will describe how a diverse dataset, including ChIPseq, ATACseq, RRBS, and WGMS data, was used for the functional annotation of the Bovine Genome. David Hawkins, from the University of Washington, will be giving a similar presentation, but on the functional annotation of the chicken genome.

Bioinformatics: This workshop will focus on the computational tools used for the interpretation of biological data and understanding genomics. This workshop is being led by Aleksey Zimin. During this workshop, Alexandre Lomsadze, from Georgia Tech, will describe the improvements in performance and accuracy of GeneMark-ETP over GeneMark-ET or GeneMark-EP+ for gene predictions. In addition, Haoyu Cheng, from Harvard Medical School, will characterize the HiFiasm assembler. HiFiasm requires PacBio HiFi, ONT ultra-long, Hi-C reads, and trio data. Haoyu will present the results of HiFiasm assemblies from 22 human and two plant genome assemblies.

Galaxy for NGS Data Analysis: This session will be a hands-on workshop that will first introduce the Galaxy platform. The session will also include a hands-on tutorial on the QC, classification, and analysis of metagenomes using short and long-read sequencing data.


Day 6, Jan 17, 2024 (Wed)

Wildlife Genomics: This workshop will discuss the evolutionary and population genomics of wild animals. Aryn Wilder, from the local San Diego Zoo, will present an update on the zoo’s conservation efforts on the Northern White Rhino. Using the southern white rhinos as a benchmark, they are running simulations on the viable fitness of restoring the Northern White Rhino using biobanked cells. Also, during this session, Mikkel-Holger Sinding, from the University of Copenhagen, will be giving a talk on three Asian Bos lineages: gaur (Bos gaurus), banteng (Bos javanicus), and the extinct kouprey (Bos sauveli). Using genomic data from historical samples, his group found that banteng is a paraphyletic group with several Bos species lineages. He suggests that these lineages are a result of significant admixture events.


Keywords: Bioinformatics, Population Genomics, Conservation Genomics, Spatial Biology, Single Cell Genomics, Spatial transcriptomics, Multi-omics, Paleogenomics, Ancient DNA, Agrigenomics, Computational Biology.

To achieve single cell resolution, NanoString developed another platform, CosMx SMI (Single Molecule Imaging), with a resolution of 1um, enabling it to detect transcripts at the subcellular level. The main limitation of CosMx is that it is constrained to ~1000 probes in each panel. This requires one to customize the probe set for each study based on data generated from the GeoMx platform. This can drive up costs and time needed to complete a study as it requires the use of two platforms. Similarly,10X Genomics also developed a newer platform, Xenium. It utilizes a probe that binds to its target on two ends, which is required for amplification. By having a two-binding site requirement, it increases specificity to each transcript. Multiple probes per gene can be used to go beyond gene expression and detect isoforms and SNPs. Like NanoString’s CosMx technology, Xenium can resolve transcripts at the subcellular level. The major disadvantage of the Xenium platform is that it can only analyze about 400 genes at a time, or less if multiple probes are used per gene.

Another technology that emerged around this time, MERFISH (Multiplexed Error-Robust FISH), is based on a much more robust ISH mechanism stemming from Femino et al’s work in 1998 on the detection of single β-actin transcripts (15). This approach named smFISH (small molecule Fluorescence ISH), used multiple fluorescently labeled probes binding to regions near the gene’s 3’ UTR and allowed for higher signal-to-noise ratio. Although smFISH has much better resolution than Visium and GeoMax, its main drawback was a very limited number of genes analyzed at a time. This is why in 2015, as a part of the Harvard Brain Science Initiative, the Zhuang Lab reported on MERFISH. Similar to smFISH, MERFISH uses a fluorescence-based barcoding scheme where multiple probes bind to a target gene, and each contain a unique binary barcode sequence. Sequential rounds of hybridization and imaging are used to read out the barcode and identify transcripts. This technology has a ∼80% detection efficiency and ∼4% misidentification rate. MERFISH has been commercialized by Vizgen under the platform name MERSCOPE. Like smFISH, MERFISH can identify transcripts at the subcellular level. Although MERFISH can identify more gene transcripts than smFISH, it is still limited to 500 genes. This represents a significant limitation for researchers as it requires nomination of candidate genes to analyze as opposed to taking an unbiased whole-transcriptome approach.

To tackle the aforementioned limitations, STEREO-Seq was launched in 2022 representing a major advance in spatial transcriptomics (16). Spatio-Temporal Enhanced REsolution Omics-Sequencing (STEREO-Seq) can analyze whole transcriptomes at best-in-class resolution of 220nm per spot. It uses DNA nanoball (DNB) patterned array chips containing a unique coordinate identifier (CID) to obtain transcript spatial information. This CID-containing oligo also contains a unique molecular identifier (UMI) and a poly-T sequence. The UMI is used to uniquely identify each molecule within each spot. The poly-T sequence is used to capture mRNA permeabilized from the tissue which next undergoes reverse transcription for cDNA synthesis. cDNAs are then sequenced using DNA nanoball sequencing (DNB-seq). This allows to obtain whole transcriptome information from individual cells within tissues at nanoscale resolution. Additionally, it allows to identify point mutations in individual cells. Compared to other high resolution spatial transcriptomic techniques, STEREO-seq gives the most complete characterization of cellular heterogeneity within a tissue. This is critical in cancer biology research for characterization of clonal tumor cell populations and the tumor microenvironment (17,18).


Taken together, spatial transcriptomics has evolved over the years to provide maximal resolution and specificity while analyzing the greatest number of genes. To date, the best platform available is STEREO-Seq, with subcellular resolution capacity and whole-transcriptome coverage.


Table summary of spatial transcriptome technologies

CosMx SMI GeoMx DSP 10X Genomics  

Xenium Analyzer

10X Visium Stereo-seq
Technology In situ hybridization + imaging In situ capturing In situ hybridization + imaging In situ capturing In situ capturing
Sample Type Fresh-frozen and FFPE Fresh-frozen and FFPE Fresh-frozen and FFPE Fresh-frozen and FFPE (RNA-templated probe hybridization and ligation) Fresh-frozen
Capture area 16mm2 to 375mm2 scan area 14.6mm x 36.2mm scan area; Selected ROI of 10µm – 600µm 12 x 24 mm scan area 6.5mm x 6.5mm per capture area; 2 or 4 capture areas per slide 1cm x 1cm chip (MiRXES)

(up to 13.2cm x 13.2cm)

Whole transcriptome sequence data No No No No Yes
# of genes that can be analyzed Pre-designed panels Pre-designed panels Pre-designed panels 18,500

whole transcriptome


Whole transcriptome

Resolution Subcellular 100 µm diameter Subcellular 55 µm per spot (1-10 cells) Subcellular (220nm per spot; 400 spots per 100µm2 cell)
Cell segmentation and Morphological context Nuclear stain and morphology markers 4 color imaging to guide profiling and ROI selection (nuclear + up to 3 antibody) H&E or IF staining H&E or IF staining Nuclear stain; H&E staining on adjacent sections (coming soon for the same section)


References


  1. Lein ES, Hawrylycz MJ, Ao N, Ayres M, Bensinger A, Bernard A, et al. Genome-wide atlas of gene expression in the adult mouse brain. Nature. 2007 Jan 11;445(7124):168–76.
  2. Seydoux G, Fire A. Soma-germline asymmetry in the distributions of embryonic RNAs in Caenorhabditis elegans. Dev Camb Engl. 1994 Oct;120(10):2823–34.
  3. Gerlinger M, Rowan AJ, Horswell S, Larkin J, Endesfelder D, Gronroos E, et al. Intratumor Heterogeneity and Branched Evolution Revealed by Multiregion Sequencing. N Engl J Med. 2012 Mar 8;366(10):883–92.
  4. Deng G, Su JH, Cotman CW. Gene expression of Alzheimer-associated presenilin-2 in the frontal cortex of Alzheimer and aged control brain. FEBS Lett. 1996 Sep 23;394(1):17–20.
  5. Hafen E, Kuroiwa A, Gehring WJ. Spatial distribution of transcripts from the segmentation gene fushi tarazu during Drosophila embryonic development. Cell. 1984 Jul 1;37(3):833–41.
  6. Kornberg TB, Tabata T. Segmentation of the Drosophila embryo. Curr Opin Genet Dev. 1993 Jan;3(4):585–93.
  7. Emmert-Buck MR, Bonner RF, Smith PD, Chuaqui RF, Zhuang Z, Goldstein SR, et al. Laser Capture Microdissection. Science. 1996 Nov 8;274(5289):998–1001.
  8. Shimamura M, Garcia JM, Prough DS, Hellmich HL. Laser capture microdissection and analysis of amplified antisense RNA from distinct cell populations of the young and aged rat brain: effect of traumatic brain injury on hippocampal gene expression. Brain Res Mol Brain Res. 2004 Mar 17;122(1):47–61.
  9. Petroff BK, Phillips TA, Kimler BF, Fabian CJ. Detection of biomarker gene expression by real-time polymerase chain reaction using amplified ribonucleic acids from formalin-fixed random periareolar fine needle aspirates of human breast tissue. Anal Quant Cytol Histol. 2006 Oct;28(5):297–302.
  10. Lashkari DA, DeRisi JL, McCusker JH, Namath AF, Gentile C, Hwang SY, et al. Yeast microarrays for genome wide parallel genetic and gene expression analysis. Proc Natl Acad Sci U S A. 1997 Nov 25;94(24):13057–62.
  11. Whitney O, Pfenning AR, Howard JT, Blatti CA, Liu F, Ward JM, et al. Core and region-enriched networks of behaviorally regulated genes and the singing genome. Science [Internet]. 2014 Dec 12 [cited 2021 Apr 28];346(6215). Available from: https://science.sciencemag.org/content/346/6215/1256780
  12. Cancer Genome Atlas Network. Comprehensive molecular portraits of human breast tumours. Nature. 2012 Oct 4;490(7418):61–70.
  13. Ernst T, Hergenhahn M, Kenzelmann M, Cohen CD, Bonrouhi M, Weninger A, et al. Decrease and gain of gene expression are equally discriminatory markers for prostate carcinoma: a gene expression analysis on total and microdissected prostate tissue. Am J Pathol. 2002 Jun;160(6):2169–80.
  14. Ståhl PL, Salmén F, Vickovic S, Lundmark A, Navarro JF, Magnusson J, et al. Visualization and analysis of gene expression in tissue sections by spatial transcriptomics. Science. 2016 Jul;353(6294):78–82.
  15. Femino AM, Fay FS, Fogarty K, Singer RH. Visualization of single RNA transcripts in situ. Science. 1998 Apr 24;280(5363):585–90.
  16. Chen A, Liao S, Cheng M, Ma K, Wu L, Lai Y, et al. Spatiotemporal transcriptomic atlas of mouse organogenesis using DNA nanoball-patterned arrays. Cell. 2022 May 12;185(10):1777-1792.e21.
  17. Wu L, Yan J, Bai Y, Chen F, Xu J, Zou X, et al. Spatially-resolved transcriptomics analyses of invasive fronts in solid tumors [Internet]. bioRxiv; 2021 [cited 2023 Feb 9]. p. 2021.10.21.465135. Available from: https://www.biorxiv.org/content/10.1101/2021.10.21.465135v1
  18. Pour M, Yanai I. New adventures in spatial transcriptomics. Dev Cell. 2022 May 23;57(10):1209–10.


Stereo-seq Stands Out Among Spatial Transcriptomics Platforms

A recently published paper titled “An invasive zone in human liver cancer identified by Stereo-seq promotes hepatocyte-tumor cell crosstalk, local immunosuppression and tumor progression” by Wu et. al. shows how liver tumor cells interact with the surrounding microenvironment during cancer progression(1). The study, available in the journal Cancer Gene Therapy, utilizes a recently developed high resolution spatial transcriptomics platform, Stereo-seq, and illustrates the molecular dialogue occurring between cancerous hepatocytes and their neighboring healthy counterparts.

This new study demonstrates the power of Stereo-seq stands out among spatial transcriptomics platforms and its unique ability to provide sub-cellular high-resolution spatial gene expression profiles while retaining the spatial context of cells within the tissue. Other methods, like single-cell RNA sequencing (scRNA-seq), offer valuable insights into cellular behavior but lack the ability to capture this context. Conversely, techniques such as FISH offer spatial context but are limited in terms of the number of genes that can be probed simultaneously. Stereo-seq bridges this gap by fusing these approaches, thus offering an unparalleled level of information regarding the spatial distribution of gene expression across a wide spectrum of genes. In contrast, Stereo-seq allows researchers to not only detect individual RNA transcripts but also to pinpoint their spatial distribution within tissue sections.

In this paper, the authors use Stereo-seq to study liver cancer. Liver cancers, including hepatocellular carcinoma (HCC) and intrahepatic cholangiocarcinoma (ICC), are one of the most prevalent and challenging malignancies worldwide. They often exhibit aggressive behavior with limited treatment options. Traditional studies have predominantly focused on deciphering genetic mutations within tumor cells themselves, inadvertently sidelining the dynamic interplay between tumor and normal cells within the tumor microenvironment (TME). In this study, the authors generated Stereo-seq datasets from 21 patients who had been diagnosed with liver cancer (HCC, n = 6; ICC, n = 15). From each of these patient’s tumors multiple tumor regions were analyzed. This included tumor tissues (T, n=12), tumor margin areas (M, n=21), paratumor tissues (P, n=10), and normal or metastatic lymph nodes (LN, n=10) from 53 sub-samples. Their attention was focused on the margin areas (M) of the tumor as this is where the cancer cells are dividing and expanding into the paratumor region containing hepatocytes. Using Stereo-seq, they mapped transcripts back to the original tissues which were stained using hematoxylin and eosin (H&E). The hematoxylin stains cell nuclei and eosin stains cytoplasm. Once the sequences were mapped back to the tissue, they were binned into pseudo-spots, each representing one cell. Each cell, or pseudo-spot, contained an average of 589–4642 mRNA molecules and 366–1897 genes. For this report, their attention was focused on the margin areas (M) of the tumor where the cancer cells are dividing and expanding into the hepatocytes containing paratumor region.


In addition to Stereo-seq data, 3 of the 21 patients whose tumors were analyzed using Stereo-seq, also had scRNA seq data generated. . The scRNA seq data was used to independently verify cell types. Using Seurat(2), they were able to cluster gene expression profiles from 62,155 cells into 11 main cell types. The cell types they found were T cells (CD3D), natural killer cells (NKs) (KLRF1), B cells (MS4A1), plasma cells (MZB1), macrophages (CD163/CD14), dendritic cells (DCs) (CD1C), cholangiocytes or malignant cells (KRT19/EPCAM), hepatocytes (ALB), endothelial cells (CDH5/ENG), and fibroblasts (ACTA2). By combining Stereo-seq, scRNA-seq, and immunofluorescence data, they found that CXCL6 was being upregulated and secreted by invasive tumor cells. This ligand, activates the JAK-STAT3 pathway in nearby hepatocytes through the CXC Motif Chemokine Receptor 2 (CXCR2). This is consistent with previous reports that showed CXCL6 activates the JAK-STAT3 pathway (3,4). Activation of the JAK-STAT3 pathway was show to lead to the overexpression of SAAs in these hepatocytes using Single-Cell Regulatory Network Inference and Clustering (SCENIC) analysis(5) . Multiplexed immunofluorescence (IF) staining was used to confirm STAT3 expression levels in SAA+ hepatocytes. IF staining was also used to confirm the location of CXCL6+ tumor cells relative to SAA+ hepatocytes in the invasive zone.

Collectively, their results underscore the essential role of local hepatocyte-tumor cell crosstalk in fostering tumor progression. The study’s findings also have broader implications for cancer therapy. The observed local immunosuppression in the invasive zone provides a potential explanation for the immune system’s limited success in targeting liver tumors. By characterizing the complex interplay between tumor cells, hepatocytes, and immune cells, this research sets the stage for designing more effective therapeutic strategies that tackle both tumor cells and their supportive microenvironment. The findings in this paper not only shed light on previously unexplored aspects of liver cancer progression but also pave the way for novel therapeutic avenues. As the field of cancer research continues to evolve, Stereo-seq stands as a testament to the power of innovation in unraveling the complexities of human health and disease.

Keywords: Spatial Transcriptomics, RNA-seq, scRNA-seq, single cell, Next Generation Sequencing (NGS), Liver Cancer, hepatocellular carcinoma (HCC), intrahepatic cholangiocarcinoma (ICC), Tumor Microenvironment (TME), JAK-STAT3 signaling pathway, hepatocytes, hematoxylin, eosin, mRNA

    1. Wu L, Yan J, Bai Y, Chen F, Zou X, Xu J, et al. An invasive zone in human liver cancer identified by Stereo-seq promotes hepatocyte-tumor cell crosstalk, local immunosuppression and tumor progression. Cell Res. 2023 Aug;33(8):585–603.
    2. Satija R, Farrell JA, Gennert D, Schier AF, Regev A. Spatial reconstruction of single-cell gene expression data. Nat Biotechnol. 2015 May;33(5):495–502.
    3. Zheng S, Shen T, Liu Q, Liu T, Tuerxun A, Zhang Q, et al. CXCL6 fuels the growth and metastases of esophageal squamous cell carcinoma cells both in vitro and in vivo through upregulation of PD-L1 via activation of STAT3 pathway. J Cell Physiol. 2021 Jul;236(7):5373–86.
    4. Sun MY, Wang SJ, Li XQ, Shen YL, Lu JR, Tian XH, et al. CXCL6 Promotes Renal Interstitial Fibrosis in Diabetic Nephropathy by Activating JAK/STAT3 Signaling Pathway. Front Pharmacol. 2019;10:224.
    5. Aibar S, González-Blas CB, Moerman T, Huynh-Thu VA, Imrichova H, Hulselmans G, et al. SCENIC: single-cell regulatory network inference and clustering. Nat Methods. 2017 Nov;14(11):1083–6.

Decoding Colorectal Cancer: The Power of Gene Expression Analysis in Molecular Subtype Classification

Introduction: Colorectal cancer (CRC) is a prevalent and deadly disease with diverse clinical outcomes and responses to treatment. Traditionally, CRC has been classified based on anatomical and histological features. However, recent advancements in gene expression analysis have revolutionized our understanding of CRC’s molecular landscape, leading to the identification of distinct molecular subtypes. In this blog post, we will explore how gene expression analysis is transforming CRC classification and offering new avenues for precision medicine and targeted therapies.

colorectal cancer 2

Understanding Gene Expression Analysis: Gene expression analysis is a sophisticated molecular technique that allows scientists to measure the activity levels of thousands of genes within CRC tumor samples. This analysis provides valuable insights into the underlying genetic alterations and biological processes that drive tumor growth and progression. RNA sequencing (RNA-seq) is a common method used to profile gene expression, enabling researchers to discover unique gene signatures associated with different CRC subtypes.

Identifying Molecular Subtypes of Colorectal Cancer: Gene expression analysis has revealed several molecular subtypes of CRC, each with distinct characteristics and clinical implications. Some of the notable molecular subtypes include:

  1. Consensus Molecular Subtypes (CMS): The landmark study by Guinney et al. (2015) [1] introduced the Consensus Molecular Subtypes (CMS) classification system. Based on gene expression patterns, CMS identified four subtypes:
    • CMS1: This subtype is characterized by immune activation and microsatellite instability (MSI), offering potential responsiveness to immunotherapies.
    • CMS2: Exhibiting features of epithelial differentiation and chromosomal instability (CIN), CMS2 tumors may respond better to conventional chemotherapy.
    • CMS3: These tumors display metabolic dysregulation and unique gene expression patterns, providing opportunities for targeted therapeutic approaches.
    • CMS4: Rich in stromal infiltration, CMS4 tumors are associated with poor prognosis, highlighting the need for innovative treatment strategies.

Clinical Implications of Molecular Subtype Classification: Gene expression-based molecular subtype classification has significant implications for CRC patients and oncologists:

  1. Personalized Treatment Selection: Identifying the molecular subtype of CRC helps tailor treatment plans to the patient’s specific tumor characteristics. For instance, CMS1 patients may benefit from immunotherapies targeting immune checkpoints, while CMS2 tumors may require different therapeutic strategies [1].
  2. Prognostic Insights: Molecular subtypes are associated with varying clinical outcomes. Understanding the subtype can aid in predicting patient prognosis and guiding treatment decisions for more effective outcomes [4].
  3. Drug Development and Clinical Trials: Gene expression analysis can identify potential therapeutic targets specific to each molecular subtype. This information accelerates the development of targeted therapies, and clinical trials can be designed to evaluate the efficacy of these treatments for specific CRC subtypes [7].

Conclusion: Gene expression analysis has emerged as a powerful tool in molecular subtype classification for colorectal cancer. The Consensus Molecular Subtypes (CMS) system and other studies utilizing RNA sequencing have provided crucial insights into the heterogeneity of CRC. By unraveling the molecular complexities of the disease, gene expression analysis is paving the way for more precise and personalized approaches to CRC diagnosis and treatment. As research in this field continues to evolve, we can expect even more advancements in our understanding of CRC subtypes and the development of novel therapies, ultimately improving patient outcomes and quality of life.

References:

  1. Guinney J, Dienstmann R, Wang X, et al. (2015). The consensus molecular subtypes of colorectal cancer. PLoS Med, 13(12):e1001453. doi: 10.1371/journal.pmed.1001453.
  2. Becht E, de Reyniès A, Giraldo NA, et al. (2016). Immune and stromal classification of colorectal cancer is associated with molecular subtypes and relevant for precision immunotherapy. Clin Cancer Res, 22(16):4057-66. doi: 10.1158/1078-0432.CCR-18-3032.
  3. Cancer Genome Atlas Network (2012). Comprehensive molecular characterization of human colon and rectal cancer. Nature, 487(7407):330-7. doi: 10.1038/nature11252.
  4. Roepman P, Schlicker A, Tabernero J, et al. (2011). Colorectal cancer intrinsic subtypes predict chemotherapy benefit, deficient mismatch repair, and epithelial-to-mesenchymal transition. J Surg Res, 171(2):e165-72. doi: 10.1016/j.jss.2011.06.016.
  5. Zhang B, Wang J, Wang X, et al. (2020). Landscape of immune-related genes in colorectal cancer identified by RNA-seq. BMC Cancer, 20(1):174. doi: 10.1186/s12885-020-07316-z.
  6. Karim ME, Wang X, Ren J, et al. (2022). Computational classification of colorectal cancer molecular subtypes using gene expression data. Comput Biol Med, 140:105409. doi: 10.1016/j.compbiomed.2022.105409.
  7. Wang Y, Jatkoe T, Zhang Y, et al. (2004). Gene expression profiles and molecular markers to predict recurrence of Dukes’ B colon cancer. J Clin Oncol, 22(9):1564-71. doi: 10.1200/JCO.2004.08.186.


Unveiling the Secrets of the Macaque Cortex: A Breakthrough in Neuroscience with Single-cell Spatial Transcriptome

In a remarkable stride forward for neuroscience, a groundbreaking study titled “Single-cell spatial transcriptome reveals cell-type organization in the macaque cortex” was recently published in the journal Cell. This study has shed new light on the intricate organization of cell types within the macaque cortex, unraveling insights that could revolutionize our understanding of the human brain.

The cerebral cortex is responsible for higher cognitive functions, such as perception, memory, and decision-making. While previous research has made significant strides in comprehending the fundamental structure of the cortex in primates, the exact organization of various cell types has remained elusive due to the complexity and diversity of neural cells.

The researchers behind this study took advantage of a newly developed cutting-edge technology called Stereo-seq (spatial enhanced resolution omics-sequencing). Stereo-seq has three distinct advantages over most other spatial transcriptomic technologies:

  • It has a detection resolution of under 500 nm.
  • It is sequenced based, which allows it to detect any transcript with a poly A tail.
  • It utilizes DNA nanoball technology which reduces sequencing costs, allowing a greater depth of transcriptome coverage.

Because of these advantages of Stereo-seq, they could explore the gene expression in the macaque cortex at an unprecedented level of resolution without sacrificing coverage.

To identify gene expression in each cell, they needed to identify the boundaries for each cell. They stained each stereo-seq section with a dye specific to nucleic acid and fluorescence-labeled concanavalin A (ConA), which marks the plasma membrane. Then they used an artificial intelligence (AI)-assisted automatic segmentation algorithm for single-cell identification based on nucleic acid and ConA images. This allowed them to analyze gene expression patterns of individual cells within their spatial context. For each cell, they identified an average of 819 transcripts and 458 genes. They performed their gene expression analysis across 143 cortical regions. Across these regions, they generated a comprehensive atlas of 264 transcriptome-defined cortical cell types while mapping their spatial distribution throughout the cortex. As a result of their study, they discovered a highly organized pattern of cell types, unveiling a mosaic-like arrangement of neural cells in the macaque cortex. This included characterizing the different cortical layers and regional preferences of glutamatergic, GABAergic, and non-neuronal cell types within these layers. They found that the distribution of specific cell types are spatially clustered, forming distinct territories that likely play crucial roles in the brain’s functioning.

Moreover, the study identified novel cell subtypes previously unknown to the scientific community. By analyzing the gene expression profiles of individual cells, the researchers could pinpoint these rare and elusive cell populations, providing a more comprehensive and accurate understanding of the brain’s cellular diversity.

One of the most fascinating aspects of this research is its potential implications for human neuroscience and neurological disorders. Macaque monkeys are often considered the closest animal models to humans when studying brain function and behavior. The insights gained from this study could thus be extrapolated to comprehend the organization of the human brain better, ultimately aiding in the study and treatment of various neurological conditions. Additionally, the single-cell spatial transcriptome technique employed in this study could serve as a powerful tool for future research, including the improvement of the Allen Brain Atlas. Stereo-seq also can uncover hidden cell types, and their spatial arrangements may pave the way for new avenues of investigation in neuroscience and potentially other fields.

To learn more about Stereo-seq and how it can help your research, fill out this contact form and a member of our team will get back with you. Mirxes is a Certified Service Provider of Stereo-seq.

DNA Nanoball Sequencing DNBSEQ™

DNA nanoball sequencing (DNBSEQ™) is a cutting-edge method for sequencing DNA that has gained popularity in recent years as an alternative to the bridge amplification method used by Illumina instruments. DNA nanoball sequencing uses a combination of nanotechnology, polymerase amplification, and fluorescent imaging to sequence DNA with high accuracy and throughput. One critical component of nanoball sequencing is the phi 29* polymerase, which plays a vital role in amplifying DNA fragments.

Like other members of the B family of DNA polymerases, Phi 29 can amplify DNA fragments with high fidelity and processivity. It can synthesize up to 70,000 bases per binding event and has robust strand displacement activity with a 3′→ 5′ proofreading exonuclease function. Phi 29 polymerase amplifies DNA fragments through rolling circle amplification (RCA). In RCA, a circular DNA library serves as a template to synthesize a single-stranded circular DNA molecule. This circular DNA molecule is then used by phi 29 polymerase to synthesize multiple copies of a complementary DNA strand. This process results in a long, branched DNA molecule called a nanoball. This nanoball contains thousands of copies of the same DNA fragment. This is in contrast to Illumina sequencing, which uses a lower fidelity polymerase and amplifies its template using bridge amplification. Both Illumina and DNA nanoball sequencing utilize the SBS method. SBS uses fluorescent imaging, where each base is detected as it is incorporated during DNA synthesis. Besides its high throughput and accuracy, another advantage of nanoball sequencing is its use of a chip containing evenly-spaced oligos. This approach is different from other sequencing technologies that use a randomly patterned flow cell (Fig 1).

Fig 1 Illustration: Red boxes indicate areas with overlapping clusters.

Technologies that use randomly patterned flow cells, like Illumina, tend to have areas on the flow cell with overcrowded clusters (over-clustered). For example, after the library solution is added, the library gets bound to the front portion of the flow cell. Then, the library concentration decreases as it flows to the back of the flow cell. In other situations, if the flow cell is overloaded (the picomolar concentration is too high), over-clustering occurs throughout the flow cell. Overcrowding can lead to multiple clusters being mistaken as a single cluster. This often results in noisy signals and drops in Q30 scores.

In conclusion, nanoball sequencing is an innovative technique for sequencing DNA that utilizes phi 29 polymerase to amplify DNA fragments through rolling circle amplification. Using a chip with evenly spaced oligos offers several advantages over a randomly patterned flow cell, including improved accuracy and coverage of the sequencing data. As sequencing technologies continue to evolve, nanoball sequencing is poised to become a powerful tool for genomics research and clinical applications.

*Phi 29 is not used by Illumina’s sequencing by the synthesis (SBS) method.

Reflecting on the AACR General Conference 2023, Orlando, Florida

To start the 2023 AACR meeting, AACR CEO Margaret Foti welcomed everyone and gave opening remarks. She said as the number of cancers around the world are increasing, it is leading to the pursuit of transformative research. She emphasized the need for collaborative studies between cancer center institutes across the US. She then announced the 312 new research fellows for the AACR academy. She also mentioned that members of AACR need to develop strategies to include underrepresented minorities in cancer clinical trials. As an example, she discussed a grant from Bristol Myers Squib which main aim is to develop strategies on how to recruit and include underrepresented groups in cancer clinical trials.

Margaret Foti’s talk was followed by talk from the current AACR president, Lisa M. Coussens, from the OHSU Knight Cancer Institute. She first thanked AACR staff for their support during her role as the AACR president. During her talk, emphasized the importance of basic research. She mentioned that there is not an instance where there is a therapeutic on the market whose development was not built on a basic science discovery. She said basic science led to biomarkers for early detection and response to treatment, new mechanisms, new therapeutic targets. She then discussed the importance of bringing translational science to the patient. As an example, she discussed the AACR project GENIE (Genomics Evidence Neoplasia Information Exchange) initiative for precision medicine. One of the goals of the GENIE project is to facilitate clinicogenomic data sharing with international cancer centers and pharmaceutical companies. She highlighted that as of this past January, this initiative led to over 167,000 samples sequenced from over 148,000 patients. This information has been made publicly available. As a part of the GENIE project, she announced 4 new cancer centers (Children’s Hospital Los Angeles, Korea University Anam Hospital, LSU Health New Orleans, and the Sylvester Comprehensive Cancer Center). These new centers were chosen based on their ability to genomically profile and treat diverse and underrepresented patient populations. Lisa Coussens concluded her talk by stating that the AACR endorses President Bidens cancer moonshot program. The Cancer Moonshot program aims to reduce cancer mortality by 50% over the next 25 years through cancer prevention and early detection along with developing new approaches to treat rare and deadly cancer types. Including pediatric cancers. She then closed by welcoming Phillip Greenberg as the next AACR president.

After Lisa Coussens’ talk, Pamela Ohashi announced the 2023 AACR lifetime achievement award to Dr. Karl H Jun, from the University of Pennsylvania, for his work in cancer immunotherapy. His lab was the first to introduce gene edited therapy for cancer.

During the AACR conference there were several major symposiums that shed light on the newest technologies that are being used for translation research. One session that stood out was the symposium on Spatial Technologies for Mapping Cancer Cell Architecture. This session was highlighted by talks from Alexander Swarbrick, from the Garvan Institute of Medical Research in Australia, and Itai Yanai, from the Grossman School of Medicine at NYU.

Alexander Swarbrick’s talk was titled spatial mapping of breast cancer cellular ecosystems. His lab approaches tumors as a dynamic ecosystem consisting of three levels.

  1. Taxonomy (single cell) – different cells that comprise a tumor.
  2. Spatial – where the cells are within the tumor space.
  3. Phenotypic – be able to determine the phenotype in the patient and understand how that can be used to diagnostics and treatment.

His lab used this ecosystem approach to create a breast cancer atlas a result of multiple stages of cancers collected over several years.

During his talk, he described a method his lab uses called SPITE-Seq (Spatial Cellular Indexing of Transcriptomes & Epitopes). SPITE-Seq is based on CITE-Seq (Cellular Indexing of Transcriptomes and Epitopes) which was developed out of the NY Genome Center. Initially, he used ~150 barcoded antibodies to combine with transcriptome data for spatial resolution. However, the data from 150 antibodies was not easily managed, so they thinned down the list of proteins to target using several methods developed in house.

Ultimately, his lab wanted to investigate if the regions within a tumor with different transcriptional profiling represented different genomic clones. To investigate this, they used Cytasssist on archival FFPE samples to look at regions with unique copy number variations (CNV) in the genome using the infer-CNV tool. Infer-CNV uses sliding windows across the genomes representing 100 genes per segment to detect coordinated changes in gene expression. This enabled their lab to infer copy number gains and loses across the genome which could be spatially resolved in an invasive carcinoma.

His lab recently began a collaboration with Joakim Lundaberg’s group from SciLifeLab in Sweden. Together they are going to expand their analysis on over 250 diverse breast cancer samples containing both scRNA-seq data and spatial transcriptomic data.

The next talk, by Itai Yanai, was titled Mapping cellular plasticity in tumor progression and drug resistance. He showed data demonstrating that cancer cells are transcriptionally heterogeneous. His work focused on identifying regions of the tumor with gene enrichments. To do this, he studied 62 tumors of different cancer types. He Identified gene modules in each tumor using scRNA-seq. Each of these modules contained enrichments of 20-200 genes. Typically, each tumor contained several modules, of which he looked for dominant modules. He analyzed these dominant modules across tumor types.

Later in his talk, he stepped back and discussed how he views the creative side of the scientific process. He likes to divide his approach to science into two parts: day science and night science. He considers day science to be primarily for hypothesis testing and night science to be where he generates his hypotheses. He then mentioned his podcast, Night Science, that goes into detail on this. In his podcast with Martin Lercher, he invites a guest scientist to explore the creative side of science. This led him to a discussion on spatial transcriptomics and how it can be used as on opportunity for identifying nano-environments in diverse cancer types. With that in mind, he did caution that low resolution plafforms, such as Visium, are not suited for hypothesis testing. However, they are good for hypothesis generation. This is because for Visium, each spot contains 5-10 cells. This means you need to infer which spots only have malignant cells. However, since there are multiple cells per spot, each spot may have both malignant and non-malignant cells.

On Thursday, April 20th AACR 2023 closed out with a recap symposium titled 2023 Highlights: Vision of the Future. The first talk was by Robert Vonderheide, the Director of the Abramson Cancer Center at the University of Pennsylvania. During his talk, he mentioned that he was impressed on the number of presentations and posters on pre-malignancy. He said that although it is important to understand invasive cancers, it is critical to understand cancers in their earliest stages. He believes that our biggest impact on the fight against cancer will be a result of our deep understanding of these early stages of cancer. He mentioned that some incredible strong, laboratory driven science that has been presented at this meeting. He made a special note on how much details about the LAG3 cell surface protein have been worked out and the sustained power of immuno-oncology. He was also pleased to see the progress that has been made with community outreach and engagement, health equity, data science, artificial intelligence, new technologies. He also made note of the incredible presence of strong clinical science at the meeting. This year there was a record number of submitted abstracts on the results of clinical trials.

One of the following speakers was Elizabeth Platz from the Johns Hopkins Bloomberg School of Public Health. Her talk title was Prevention, early detection, population sciences and disparities research. To begin her talk, she discussed a recently published paper in the journal Cancer Discovery by Meredith Shields. The title of the Shields et al. paper is “Opportunities for Achieving the Cancer Moonshot Goal of a 50% Reduction in Cancer Mortality by 2047.” The main theme of the paper was that action is going to be needed to be able to achieve the moonshot goal. The action she suggested was based on behavioral economics and nudges to improve cancer care and increase screening. She mentions systems, protocols, and information that can be put in place to motivate individuals and patients and providers to taking action. Elizabeth also mentioned Kelsey Lau-Min presentation that encouraged decision making to be guided more efficiently. For example, when ordering a test, make it automated as an opt out rather than an opt in. She also mentioned optimizing precision oncology care through nudges. She brought up examples of reflex biomarker testing, interpretation, and treatment matching all along the continuum to patient precision testing. The caveat of these strategies is that they do involve lots of subspecialty expertise. So, for these to work, the workflow has to be optimized. There needs to be a bioinformatics pipeline and it must all be embedded within the electronic medical system. Towards the end of Dr. Platz’s talk, she discussed a group’s research addressing African genetic ancestry and trying to understand whether that ancestry can explain higher risks of certain cancers like head and neck cancers. She noted that it was previously showed that US and global populations with African ancestry have notable genetic diversity. She then discussed work that suggested genetic diversity can affect treatment response, especially when DNA repair genes are involved.

Overview

The completion of The Human Genome Project in 2003 marked a big leap in the development of genomics technology, allowing for more robust and cost-effective methods with reduced turnaround time. Genomics has immense potential in both research and clinical settings. In the research sphere, it can unlock secrets related to unknown genes and their mechanisms, pathways leading to disease or poor prognosis that can then be used for development of new tests and treatments while in terms of clinical use, it can cover everything from diagnosis to treatment of human diseases. This has naturally stirred interest among scientists, clinicians and translational researchers, prompting some to build up the necessary infrastructure in-house while others turn to external service providers. Consequently, many biotechnology companies have been set up to offer such services. At this point it is essential to understand factors to consider while seeking or engaging with providers of such services.

Types of Genomics Services

Ready-to-use kits and protocols are available for laboratories and buyers that have the necessary in-house infrastructure and expertise. These simpler solutions reduce the complexity associated with genomics testing and analysis.

Laboratories and buyers lacking the required infrastructure and expertise can access a wide range of services such as DNA and RNA sequencing; genotyping to detect single nucleotide variant (SNV), single nucleotide polymorphism (SNP) and copy number variations (CNVs) as well as genotyping of targeted regions and whole genome; epigenetics, gene expression and transcriptome analysis. Typically, technologies such as microarrays, quantitative or Real-Time polymerase chain reaction (qPCR or RT-PCR) and next-generation sequencing (NGS) are leveraged to provide genomics services.

Selection of Services

Bearing in mind the pros and cons of the technology used, the selection of service will be primarily guided by the cost and aim of the testing.

For example, when the aim is to identify known sequence variants (typically for small number of target genes and samples), targeted sequencing (for example, exome sequencing) using RT-PCR or microarrays may prove more cost effective.

On the other hand, when the aim is complex, and there is interest to uncover novel variants as well, more costly whole genome sequencing (WGS) can be utilized. WGS using NGS would be more appropriate for sequencing large genomes, such as human genome.

Similarly, to understand complex genetic diseases that are multifactorial (caused by genetic and environmental factors) or do not follow inheritance model, WGS using NGS with or without other omics analysis (for example, transcriptomic, proteomic, or epigenetic analysis) may be inevitable.

It is also noteworthy that, with easy accessibility and reduced cost, NGS is gaining more popularity.

Utilization of Genomics

While genomics has traditionally been applied in research settings, it is increasingly demonstrating its utility in clinical settings.

For example, ready-to-use kits and protocols have facilitated discovery and identification of novel biomarkers associated with diagnosis, prognosis and treatment of human diseases such as pancreatic cancer,1 diabetic macular edema,2 breast cancer,3 colorectal cancer4 and lymphomas,5 to name a few.

In clinical setting, WGS demonstrated accurate genomic profiling with shorter turnaround time for risk stratification6 of patients with acute myeloid leukaemia (AML) or myelodysplastic syndromes (MDS). It was also able to correctly classify the inconclusive results from the standard cytogenetics testing.

In another study, WGS identified 18 new diagnoses which included structural and non-exome sequence variants7 that were not detected with the conventional whole-exome sequencing (WES) suggesting the role of WGS as primary clinical test in a setting of paediatric non-genetic subspecialty clinics.

Rapid WGS demonstrated clinical utility with shorter turnaround time of 13 days compared to 107 days required for standard testing8 in case of rare disease testing for critically ill children.

In case of non‐invasive prenatal testing (NIPT), while WGS using NGS can provide a comprehensive analysis of the whole genome, more cost-effective approaches such as targeted sequencing or SNP detection using microarray analysis can also be deployed. For example, microarray quantitation platform has shown comparable results for detecting common trisomies.9

Although genomics testing is thought be a costly affair, in certain conditions, it has the potential to end the diagnostic odyssey,10 thus facilitating timely management. This in turn eliminates extensive diagnostic work up and inefficient management that contribute to overall cost saving.

Things to Consider When Selecting a Genomics Service Provider

When selecting a genomics service provider, there are a few considerations to consider, especially when end-to-end services are needed. The crucial deciding factors include:

  • Availability and actionability
  • Cost and affordability of testing
  • Accreditations and Certifications
  • Timelines/turnaround time
  • Infrastructure, expertise, and experience
  • Bioinformatics analysis
  • Report reading, assessment and interpretation
  • Reliability of the results
  • Insurance providers in-network
  • Data protection, storage, handling of left over sample
  • Publication ready, compatible graphics/output including raw data
  • Customizable services and support

Current Limitations

Despite the increasing popularity of genomics testing, one should be mindful of the inherent limitations associated with the technologies used in genomics testing and analysis. For example, NGS has high error rates11;RNA sequencing12 may get influenced by factors such as GC content, read depth and secondary structure.

Furthermore, although genomics is growing in its applications, many gaps remain when it comes to the necessary knowledge, experience and qualifications needed at points of the process like report analysis and its implications. Nevertheless, these limitations are expected to be addressed as people make use of genomic testing more, together with more collaborations between service providers and buyers. This is likely to offer further information on the clinical effectiveness of such tests.

The Bottom Line

Genomics has the potential to contribute to and improve human health, and is expected to be a crucial tool in the near future with its increasing use and accumulation of evidence of its effectiveness.


References

  1. https://pubmed.ncbi.nlm.nih.gov/32145274/
  2. https://www.ncbi.nlm.nih.gov/pmc/articles/PMC7564365/
  3. https://www.ncbi.nlm.nih.gov/pmc/articles/PMC8124944/
  4. https://www.ncbi.nlm.nih.gov/pmc/articles/PMC9737596/
  5. https://www.mdpi.com/2072-6694/15/2/453
  6. https://www.nejm.org/doi/full/10.1056/NEJMoa2024534
  7. https://www.ncbi.nlm.nih.gov/pmc/articles/PMC5895460/
  8. https://www.nature.com/articles/s41525-018-0045-8
  9. https://www.ncbi.nlm.nih.gov/pmc/articles/PMC5057317/
  10. https://www.ncbi.nlm.nih.gov/pmc/articles/PMC7928067/
  11. https://www.ncbi.nlm.nih.gov/pmc/articles/PMC9895957/
  12. https://www.ncbi.nlm.nih.gov/pmc/articles/PMC5330537/


History of Spatial Transcriptomics: Spatial Transcriptomics of Tissue Regions

To overcome the limitation of only being able to study gene expression in areas of a tissue that were isolated by LCM, a group at The Spatial Research Lab at the Science for Life Laboratory developed a novel slide-based transcriptomics approach. This group was led by Drs. Joakim Lundeberg, Stefania Giacomello, and Patrik Ståhl (14). The spatial transcriptomics (ST) technology they developed utilized single-stranded DNA probes, spotted on a slide in a manner similar to microarrays. These slide-bound DNA oligo probes contain a spatial barcode to map back to its position on the slide for spatial expression analysis. The oligo also contains a Unique Molecular Identifier (UMI) to differentiate the probes on the same spot. At the 3’ end of the oligo probe, it contains a poly-T tail to capture polyadenylated mRNA released from the permeabilized tissue. The captured mRNA is reverse transcribed resulting in a spatially barcoded cDNA that is prepared as a library for next generation sequencing (NGS) (14). The end result is whole transcriptome sequencing data that can be mapped back to its original location in the tissue. Initially, the ST microarray consisted of ~1000 spots, each with a diameter of 100um. At the end of 2019, the ST technology was acquired by 10X Genomics and commercialized under the name Visium. 10X Genomics increased the number of spots on the array to ~5000 and reduced the diameter of each spot to 55um. At this resolution, each spot covers 1-10 cells. Although this greatly improved the resolution for ST, it is still not able reach the level of single cell or the ultimate goal of subcellular resolution.

In 2019, NanoString Technologies also launched its first spatial transcriptomics platform, GeoMx DSP (Digital Spatial Profiler). This technology enabled multiplexed spatial profiling of not only RNA but also proteins. Unlike Visium’s method of capturing and sequencing RNA via an oligo dT probe, the GeoMx DSP probe uses a unique complementary sequence to directly hybridize to a transcript of interest. This target-specific capture probe is attached to a DSP barcode via a photocleavable linker. The DSP barcode is used to backtrack the location of the transcript in the tissue. These barcodes can be analyzed downstream in the workflow using NanoString’s “n-counter” system or by NGS, depending on the number of genes desired for analysis (~1000 or ~18,000, respectively). Two of the most significant limitations of the GeoMx DSP system are its resolution and single molecule detection approach. Like Visium, GeoMx cannot detect genes expressed in individual cells (resolution can only go down to 100µm).

Top questions about spatial transcriptomics

What is a Unique Molecular Identifier (UMI) for Stereo-seq?

Unique Molecular Identifiers or UMI are short sequences or molecular “tags” contained in each oligo on a Stereo-seq chip. Each oligo within a spot on the Stereo-seq chip has its own UMI to identify that individual oligo.

What are limitations of the Visium and GeoMx Digital Spatial Profiler technologies?

Two of the most significant limitations of the GeoMx DSP system are its resolution and high cost. Both 10x Genomic’s Visium and NanoString’s GeoMx DSP cannot detect gene expression at the single cell level as each spot typically overlaps 5 to 10 cells. The costs to run each of these platforms, including sequencing, is often over $10,000 for each sample.